Let’s celebrate Valentine’s Day with some nerdy love! In this post, we will create heart-shaped plots using Python, R, and Matlab. These heart-shaped plots are a fun and creative way to express your love for programming and data visualization. Let’s get started!
Python
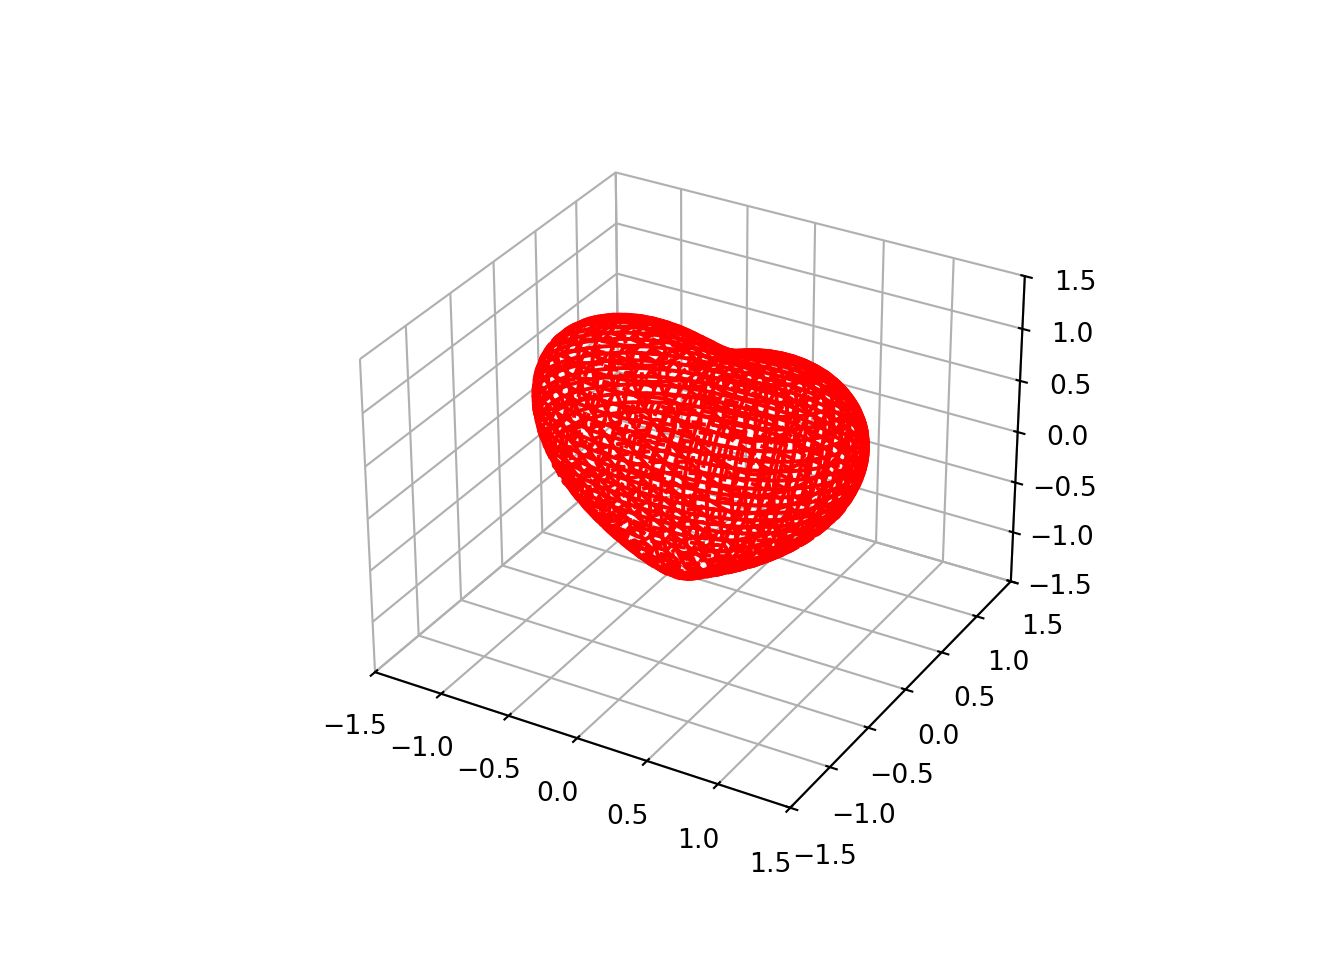
Here is a Python code snippet to plot a 3D heart shape using Matplotlib:
from mpl_toolkits.mplot3d import Axes3Dfrom matplotlib import cmfrom matplotlib.ticker import LinearLocator, FormatStrFormatterimport matplotlib.pyplot as pltimport numpy as npdef heart_3d(x, y, z):return ( (x**2+ (9/4) * y**2+ z**2-1) **3- x**2* z**3- (9/80) * y**2* z**3 )bbox = (-1.5, 1.5)xmin, xmax, ymin, ymax, zmin, zmax = bbox *3fig = plt.figure()ax = fig.add_subplot(111, projection="3d")A = np.linspace(xmin, xmax, 100) # resolution of the contourB = np.linspace(xmin, xmax, 40) # number of slicesA1, A2 = np.meshgrid(A, A) # grid on which the contour is plottedfor z in B: # plot contours in the XY plane X, Y = A1, A2 Z = heart_3d(X, Y, z) cset = ax.contour(X, Y, Z + z, [z], zdir="z", colors=("r",))for y in B: # plot contours in the XZ plane X, Z = A1, A2 Y = heart_3d(X, y, Z) cset = ax.contour(X, Y + y, Z, [y], zdir="y", colors=("r",))for x in B: # plot contours in the YZ plane Y, Z = A1, A2 X = heart_3d(x, Y, Z) cset = ax.contour(X + x, Y, Z, [x], zdir="x", colors=("r",))_ = ax.set_zlim3d(zmin, zmax);_ = ax.set_xlim3d(xmin, xmax);_ = ax.set_ylim3d(ymin, ymax);ax.xaxis.set_pane_color((1.0, 1.0, 1.0, 0.0))ax.yaxis.set_pane_color((1.0, 1.0, 1.0, 0.0))ax.zaxis.set_pane_color((1.0, 1.0, 1.0, 0.0))plt.show()
R
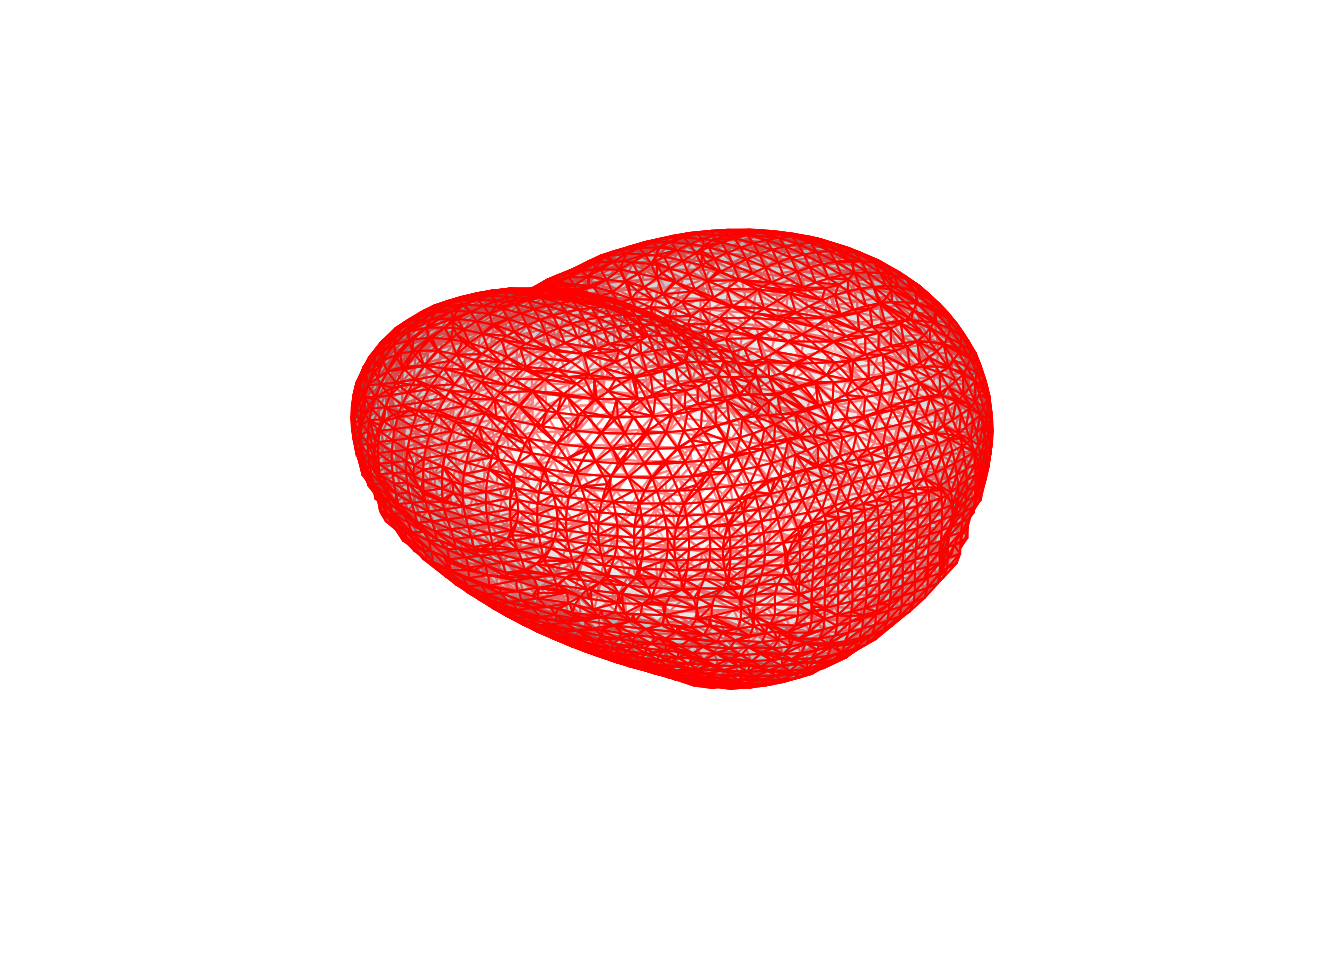
In R, we can use the rgl and misc3d packages to create 3D mesh plots. Here is the R code to plot a heart shape:
options(rgl.useNULL =TRUE) # Use NULL device if display is not availablelibrary(misc3d)library(rgl)heart_3d <-function(x, y, z) { (x^2+ (9/4) * y^2+ z^2-1)^3- x^2* z^3- (9/80) * y^2* z^3}# Create a grid of points in 3D spacex <-seq(-1.5, 1.5, length.out =50)y <-seq(-1.5, 1.5, length.out =50)z <-seq(-1.5, 1.5, length.out =50)# Generate 3D grid of function valuesgrid <-expand.grid(x = x, y = y, z = z)values <-with(grid, heart_3d(x, y, z))# Reshape to 3D array for contour3ddim_values <-c(length(x), length(y), length(z))values <-array(values, dim = dim_values)# Create 3D contour plotcontour3d(values,level =0,x = x, y = y, z = z, col.mesh ="red", alpha =0.5, engine ="grid")
Matlab
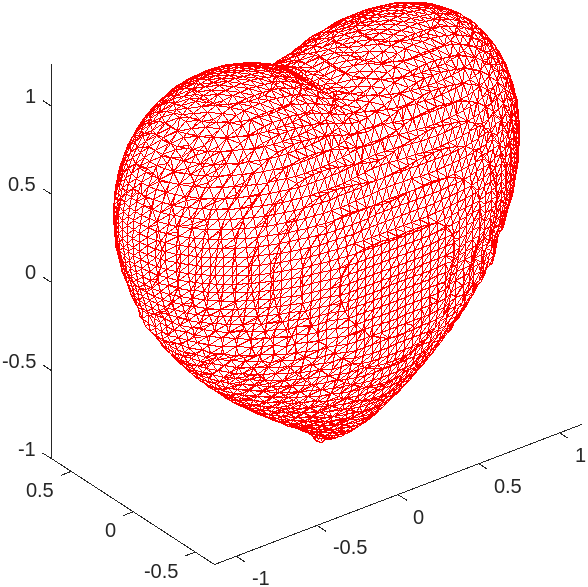
The code for plotting 3D shape in Matlab is much more laconic than in Python or R. Here is how to plot a heart shape in Matlab:
Now you have three beautiful heart-shaped plots created using Python, R, and Matlab. Share these plots with your loved ones and spread the nerdy love this Valentine’s Day!